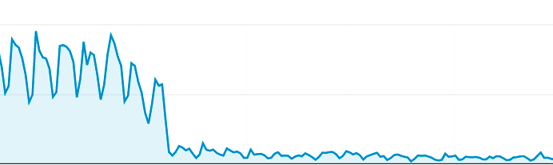
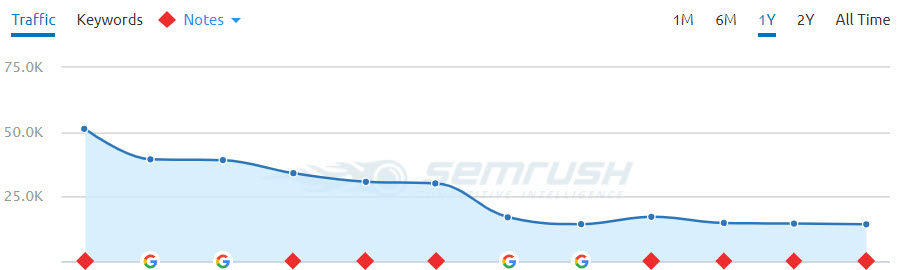
One day you wake up and you log-in to Google Analytics, or Google Search Console, or SEMrush, or some other traffic or keyword tracking system, and you see something like this:
Seeing graphs like this sucks. That feeling in the pit of your stomach, the exclamation of “oh shit, what happened?!” or “my boss/client is gonna kill me”. Not good, not good at all.
The bad news is, traffic drops are super common, and there are TONS of potential reasons for it. It could be your fault, or a dev’s fault, or a partner’s fault, or Google’s fault, or, well, you get the point.
The good news is this: I can help you find and fix the problem, quickly. (Well, quick-ish, depending on the actual problem.)
I’m going to walk you through EVERYTHING I would do, step-by-step, to diagnose and fix a drop in organic traffic. Be prepared though, this is a long post, because there are SO many things that can go wrong.
—
One Caveat: If you’ve been engaging in black hat SEO tactics (shady link building, content scraping/spinning, cloaking, etc.), this guide is not for you. This is for people with legitimate websites who’ve been doing things above board. If you actively game the system, then you already know where you should start looking when your traffic tanks :/
—
Now, some of this can get a bit technical, so if you feel out of your depth, I offer in-depth SEO audits as a service. I’ll go through this process for you, on the site of your choice, and provide you with a report of everything that is right and wrong from an SEO perspective, with recommended fixes, and with everything prioritized based on impact. Just contact me if this is something you’d like.
Without further ado, here’s my foolproof guide to finding and fixing the source of a drop in your organic website traffic:
8 Steps to Find and Fix Any Organic Traffic Drop
- Step 1 – Google Algorithm Updates and Penalties
- Step 2 – Check Your Web Analytics
- Step 3 – Check Google Search Console
- Step 4 – Check SEMrush
- Step 5 – Check Google Trends
- Step 6 – Crawl the Site
- Step 7 – Check Your Server Logs
- Step 8 – Check Your Links (Ahrefs, Moz, Majestic)
I’d recommend going through these steps in order, but if you have an inkling that your problem is tied to something specific, by all means skip ahead!
Also, be aware that many traffic drops aren’t due to a single thing; some are multifaceted issues. As you go through this guide, make note of the different things that seem to be issues, and go through this entire list even if you think you found the issue early on.
Better safe than sorry.
TL;DR? Download a PDF copy of this guide:
Step 1 – Google Algorithm Updates and Penalties
When dealing with a sudden, unexpected traffic drop, a Google algorithm update of some sort is as likely a culprit as any. These can vary a lot, and to be fair Google is constantly testing and rolling out updates of various sizes, but it’s a good first possibility to explore.
Do keep in mind though that sometimes a drop can be temporary, as Google often tests a change for a few days or even a week or two on a sub-set of sites, and then rolls it back later or removes your site from the test bucket.
Still go through this list to be safe, but don’t start freaking out unless the drop persists for at least a week or two.
Now, before you do anything else, check here to see if there was an update, and then go here to find more details on the nature of the update.
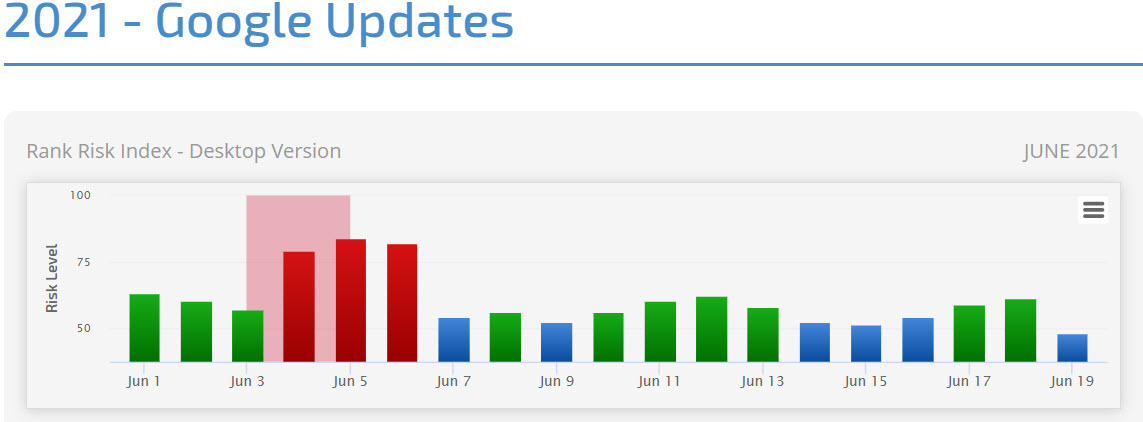
You’ll be able to see if a known Google update hit, and what it was most likely about. Search Engine Land (the 2nd link above) does a good job of monitoring the forums and reporting on chatter from webmasters whose sites have been impacted.
The SEO community is pretty tight knit, and very sharp, so it never takes more than a few days at most to determine that something happened and what it most likely was.
If the nature of the update very closely aligns with your site (say, you have a health and wellness site that was hit by the Medic update), and the timing aligns well, there’s a very high chance you’ve found your problem.
Even if this seems likely though, there are other things that need to be ruled out.
Now keep in mind, when Google rolls out an update, the full impact is rarely instant. Usually it rolls out over the course of a week or two, but sometimes far longer.
If your traffic dropped sharply and suddenly, you should also check Google Search Console for a manual penalty message (you generally have to log-in to see the message, though email alerts can be enabled), as a penalty can hit instantly in full force.
A good general rule is this: if the drop in traffic and/or rankings is sudden and very sharp (>50% drop), it could very well be a penalty of some sort.
If the drop is more like a slow decline over weeks or months, it’s most likely a broad algorithm update or something else entirely (new strong competitor, decline in search volume in your space, etc. etc.).
First, let’s dig into penalties a bit more. If you have received a manual penalty, you should be able to see a message in Google Search Console explaining the reason for the penalty, with some details on what to do next.
Penalties come in a variety, but Google gives you a nice rundown of the various types and how to fix them here, and you can find additional details here.
If you get a penalty notice, you need to address it ASAP. But you’ll only get this if you have Google Search Console set-up for your site, so make sure you do that!
Of course, that’s just for manual penalties (when a Google Quality rater determines via a manual review that you have violated their Quality Rater Guidelines.) If you’re responsible for a website and organic traffic is an important channel, read this guide.
If you receive a manual penalty, depending on what sort of penalty it is, you could get it fixed quickly (a few days to a week), or never (link related or pure spam penalties can stick around for a LONG time). If you’ve been keeping your SEO efforts above board, anything that pops up here is probably accidental and should be easy to fix.
Some penalties will impact the whole site, and some will only impact certain pages (Google will tell you in GSC if it affects the whole site or certain pages).
If you have a particularly nasty penalty though, it can sometimes result in your site being de-indexed (removed from Google’s search results). Do a Google search for your brand name, and also for your website homepage URL. If your domain isn’t showing for your brand name or for a direct URL search, you’ve been de-indexed. That would definitely explain a drop in traffic 😉
The other side of the coin is algorithmic filters (such as Panda, Penguin, etc.). These aren’t penalties per se, just changes to the core algorithm, but they DO hurt sites that violate Google’s guidelines, so I still personally think of them as penalties.
There’s a great guide here that digs into penalties and filters, and if you think this might be your problem, then give this a read.
Now, even if there was an algorithm update or a penalty notice that coincided with your traffic drop, that doesn’t mean it was the cause. Correlation is not causation.
You should still run through steps 2-8 to make sure you’ve ruled out other possible causes.
Step 2 – Check Your Web Analytics
While you’ve probably already looked in Google Analytics (or whatever analytics platform you use), as I assume that’s how you saw your traffic drop, there are some specific things you need to look for to help iron out the source of the problem.
First, make sure you’re actually looking at just organic traffic, and not all traffic sources combined. This guide focuses only on organic traffic declines, and won’t help you with drops in direct, referral or paid traffic.
To do this, in Google Analytics, on the left side of the page, click Acquisition, then All Traffic, then Channels, then in the middle of the screen click into Organic Search.
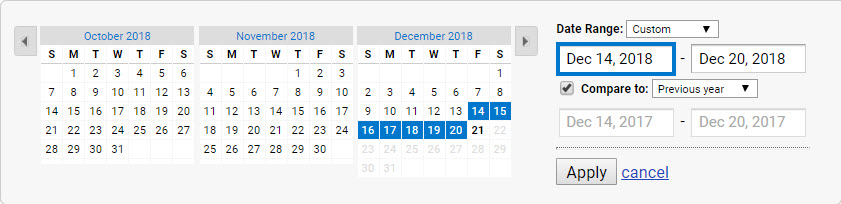
Next, compare the time period where your traffic dropped to the same period the previous year. Make sure you’re looking at a week or more of data, as anything less won’t be super helpful.
Is traffic up or down in the same period year over year? Is this drop a seasonal drop? Is it normal for your site or your industry? If you saw a similar drop last year, and it recovered, then maybe you can stop stressing 🙂 Still keep an eye on things though, and if traffic doesn’t bounce back like last year, you can dig deeper.
In some cases, traffic will drop around the same time each year, but someone who hasn’t been around for previous years might not know this, and could freak out about it. It happens.
So first things first, try to determine if it’s a normal drop or an abnormal one.
I once worked for a company that got a lot of adult-centric traffic from Islamic countries (looooong story), and they always saw a huge drop in organic traffic during Ramadan. Once I realized this drop happened each year, I was able to dig in and figure out the rest.
Since this was a traffic segment that drove no revenue, it wasn’t a big deal, and we stopped scrambling to find the problem, because there wasn’t one. Business as usual.
As an aside, I recommend keeping a company Wiki with info on stuff like this, or at the very least recommend adding a note in your analytics data to previous traffic drops, so new folks can more easily find stuff like this. It would have saved me a lot of time and hassle.
If your site is new, or for some reason you don’t have year over year data, you can also get a similar view into this in Google Search Console (covered in Step 3) and an analogue data point in Google Trends (Step 5).
Now, it’s important to determine if the drop is general across the site, or if it’s tied to specific pages. You can do this in the same part of GA above, you just need to change your Primary Dimension from Keywords over to Landing Page.
You’ll then see something like this (URLs are obscured for confidentiality):
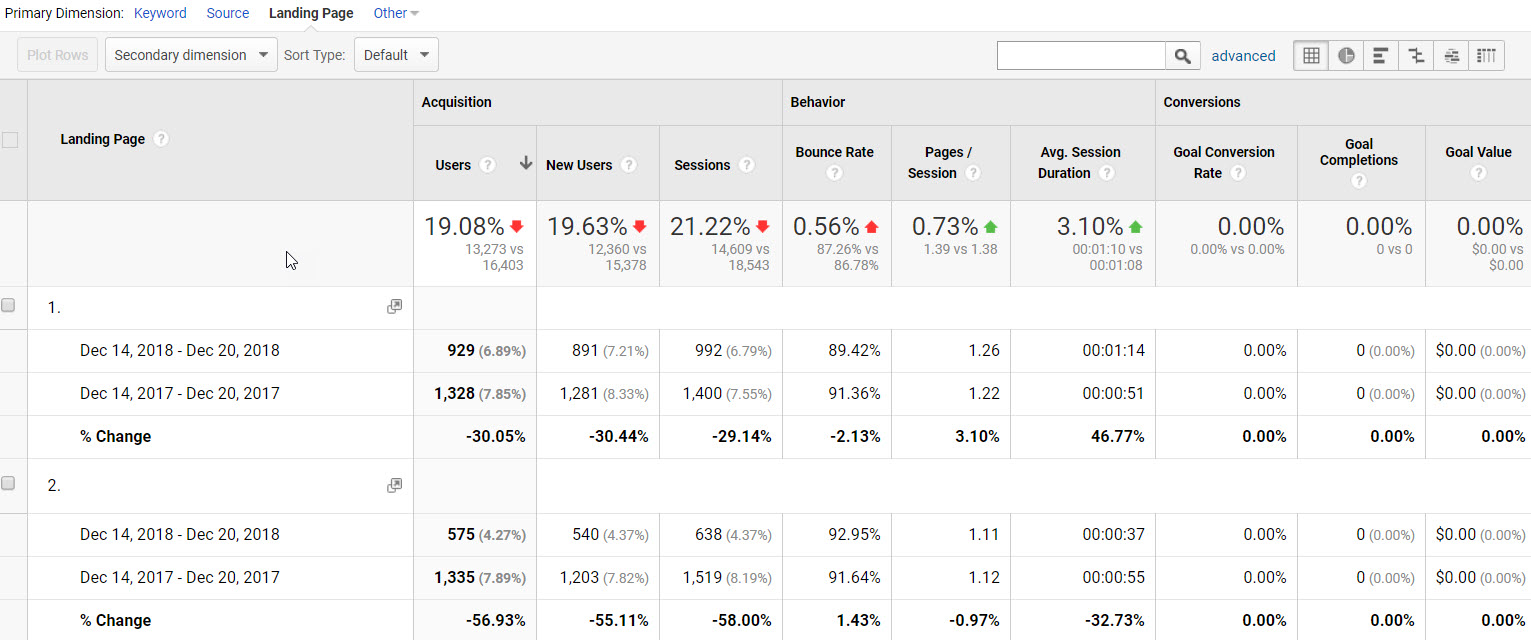
If most pages look down year over year, then you know whatever is impacting you is site-wide, which will help us narrow things down. If that’s the case, a few technical issues could be at play:
1. You might be blocking bots in some way at the site-level; check your Robots.txt file, your page-level Meta Robots tags, your X-Robots-Tag in the header (this page and this page can help if you don’t understand these things), your server settings (such as your Apache Htaccess file; don’t mess with this if you aren’t a dev), and your DNS and/or CDN provider settings (especially if you use CloudFlare, which can be wonky). Talk to your webmaster or IT department and make sure they didn’t do something dumb like block Googlebot (“umm, Googlebot was hitting the server too hard, so yeah, we blocked it”…I’ve heard this more than once, facepalm).
2. To see if they did block Googlebot (it happens, sadly), you can use Chrome or Firefox with a User Agent Switcher plugin, and set your User-Agent to Googlebot, and try visiting the site. If you can’t reach the site while Googlebot is your UA, then you’ve got a problem!
3. You can also try crawling the site as Googlebot (covered in Step 6) using something like Screaming Frog SEO Spider or Sitebulb. If the crawler can’t reach the pages with the user-agent set to Googlebot, this confirms you’re probably blocking Googlebot in some fashion (or you could be using CloudFlare, which blocks Googlebot user-agent from IP addresses that aren’t known to belong to Google, which is actually a really stupid idea and my biggest pet peeve with CloudFlare).
4. Check your server logs (covered in Step 7) to see if there has been a drop in hits to the server from Googlebot over the time period of your traffic decline vs. a previous time period. If Googlebot is visiting less (or not at all), this can also indicate a bot blocking problem.
5. Technical issues aside, site-wide problems could also be indicative of algorithm updates/filters or even manual penalties, so dig deeper on that front (addressed in Step 1).
It’s also important to check and see if your direct or referral or paid traffic pools went up commensurate with the drop in organic. Sometimes the paid search team will turn on a branded keyword campaign, which increases traffic to the paid channel from brand terms, but cannibalizes traffic from organic for the same.
Other times traffic that should be classified as organic gets misattributed as direct (called dark traffic), for a variety of reasons, so be aware of dips in one traffic bucket and simultaneous rises in another.
If only one or two pages (or a small % of the site overall) are being impacted, or if the per-page drop Y/Y is a single digit percentage (<10%), it could be a few other things:
1. Check those few pages for the same issues listed in #1 above; you might have accidentally blocked those specific pages to bots somehow. You can easily test specific pages in Google Search Console with the Robots.txt checker.
2. Check the rel=”canonical” tags on those impacted pages, and make sure the canonical tag contains the IDENTICAL URL of the actual live page. If the URL isn’t exactly the same in the canonical as it is in the address bar of your browser, that could be the problem. If a page gets pointed somewhere else via a canonical tag, the origin page could decline in rankings and traffic.
3. Check to make sure the pages that have dropped aren’t being redirected somewhere else (301, 302, etc.) You’ll need to do this test as both a normal browser user, as well as with your agent set to Googlebot; sometimes redirect rules are put in place just for bots. You can do this with https://httpstatus.io/.
4. Check to make sure those pages aren’t reporting a server error (404, 500, etc.) If the page is broken or the server isn’t serving it properly, that can harm rankings and traffic. https://httpstatus.io/ will also help with this.
5. Use Screaming Frog to crawl in list mode, and check just the affected pages. Watch out for things like Redirect Chains or Loops, errors, etc. This is addressed more in Section 6 of this guide.
Whether the whole site or just a few pages was affected, you’ll be able to dig one level deeper using Google Search Console, so that’s where we’re going next.
Step 3 – Check Google Search Console
Every business with a website, no exceptions, should have Google Search Console configured for their site.
I’ve written a simple guide you can get here to help set-up GSC properly for your site. If you don’t already have this in place for your site, go do this now.
There are 5 main areas in Google Search Console we’re going to look at (there’s way more you can get from GSC than just these things, but these are the areas that are going to help you identify potential causes for your traffic drop):
- Performance Report (New GSC)
- Coverage Report (New GSC)
- Blocked Resources (Old GSC)
- Crawl Stats (Old GSC)
- Fetch as Google (Old GSC)
1. Performance Report (New GSC)
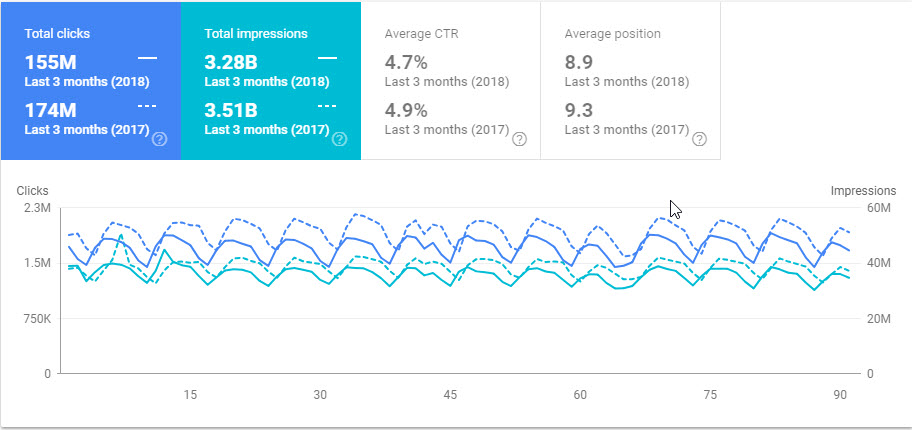
In the old GSC this was called the Search Analytics report (which I actually liked better in some ways), but now it’s the Performance Report.
In this report, you get to see a HUGE amount of data about your site’s rankings and organic traffic. You can see things like:
- Ranking keywords, with impressions, clicks, average CTR and average ranking position.
- Ranking pages, and which keywords those pages rank for.
- Which countries you’re getting traffic from.
- Which devices your traffic is coming from.
- Which SERP features are showing for your ranking keywords.
You can see this data going back 16 months now (it used to be 90 days), so this is epic. You can also sort and filter this data across multiple variables, which helps a ton in identifying problems.
I’d recommend beginning by filtering the data time-frame to Compare Last 3 Months Year Over Year (shown in the image above). Then you can click through Keywords, Pages, Countries, Devices, and Features to begin digging.
First and most importantly, do you see a decline in impression and/or clicks recently that matches up with what you saw in your analytics data? If your analytics showed a steep decline, but you don’t see that reflected in Google Search Console, you might have an analytics tagging or firing problem and not an actual traffic loss.
I once worked with a company that had this happen. Analytics reported a huge organic traffic loss, but GSC didn’t show any such thing. It turned out someone had updated a set of pages on the site and forgot to include the proper analytics tracking code. Whoops.
Another time, a site change was made that slowed down a large set of pages dramatically. Since the analytics tag was set to fire after everything else on the page, and the page was so slow that people were bouncing at a very high rate, most visits never even registered in analytics because they left the page before the code fired. Whoops again.
Assuming the traffic loss appears in both GA and GSC, let’s move on.
What you’re looking for in the data here are patterns:
– Are there specific keywords or keyword buckets that have declined more than others? You can filter the Keyword section by certain queries, and I’d recommend doing one where you include the first few letters of your brand name to see if Branded has dropped more than Non-Brand.
– Have certain pages declined more than others, or evenly across all? If certain pages, what if anything do those pages have in common?
– Has traffic declined from certain countries, or across all of them?
– Has traffic declined on certain devices, or uniformly across all? Have you lost traffic from one source but gained in another, but the gain has not cancelled out the loss?
– Has there been an increase in SERP features for your ranking keyword set? This alone can account for a decrease in traffic over time, especially knowledge graph panels or the increase from 2-3 ad units above the fold to 4. For some results, between ads, KG, maps, local results, pictures and videos, the actual “organic” results could be so far down the page now that your CTR, even in a “#1” position, could be 1/10th what they used to be.
![]()
As you’re looking at this data, there’s no right or wrong here. You’re just trying to see if you can narrow the issue down to a more specific thing, and any sudden shift on one of these charts can help you to spot it.
If the traffic is declining primarily from one country, you could go see what’s happening in that country (holiday, political unrest, power outages, etc.)
If the traffic is declining from a specific page or a few pages, you can check to see if those pages are reachable to bots by using the Robots.txt Checker or the Fetch and Render tool in GSC.
If the drop is coming from a specific bucket of keywords, you could check to see if the average ranking position or CTR has declined, or if a new competitor is now outranking you. You could also check to see if Google has made an update recently that might affect pages of that topic.
If the drop is coming from a certain device type (desktop, or mobile), you could check to see if your page load speed has gotten worse for desktop or mobile visitors. You could also check trends in the decline of certain device types, to see if the drop you’re experiencing is in-line with those trends.
If the issue is site-wide, then there are other things you can look into, as follows.
2. Coverage Report (New GSC)
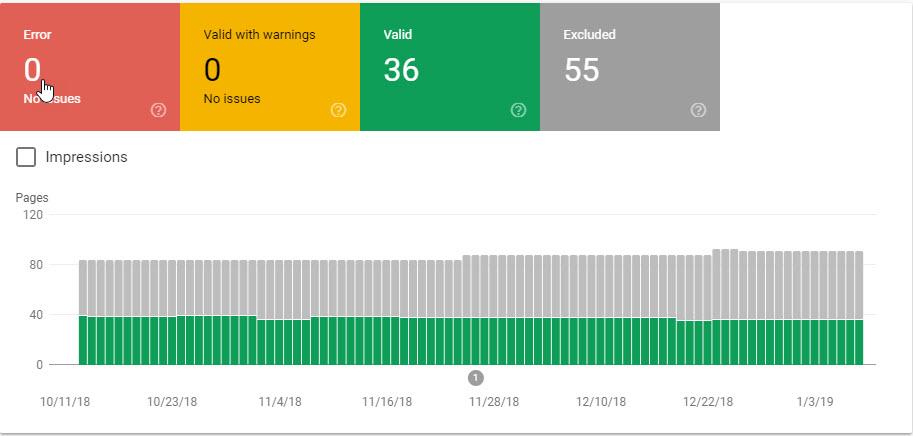
I really dislike the new coverage report, unfortunately, as it isn’t as visually helpful as the old report, and I’m a really visual person. Data-wise though, it’s good enough. Google has a huge guide to this report here.
What you’re most looking for here would be an increase in Server Errors, Soft 404s, or Not Found errors, as those are the most likely to impact your traffic. Server Errors especially can impact your traffic in a short period of time if not corrected.
If you see a sharp spike in server errors, see what sort of issues your servers have had (maybe they can’t handle your traffic load), and see if there have been any site outages. If you took the site down for maintenance or for a site redesign, that could be a factor.
If you see a spike in Soft 404s, that means Google is finding a bunch of pages that are returning a 200-header response (a live page), but that contain no content (should be a 404). Thus the soft 404 designation.
Lastly, Not Found errors are typically 404s, which tells Google a page that is linked to from somewhere (on your site or off) is not resolving (showing a 404 error). If the pages returning 404s are pages that used to bring in traffic, that’s a problem.
In this case, check to see if you’ve made any URL changes on the site, and forgot to set-up 301 redirects.
Generally, if a URL is throwing a 404, you should 301 redirect that page somewhere. If the page never actually existed, it’s OK to leave it a 404. And if it did exist but you don’t want to redirect it for whatever reason, change the header response to 410 (removed permanently). 404 means “whoops”, and Google doesn’t like them.
Even if there hasn’t been a big shift in errors, if you have a lot of them, you should work to fix them to avoid potential issues down the road (especially server errors).
The other thing you’re looking for here is a sharp decline in number of indexed pages, or an increase non-indexed or erroring pages. If Google is suddenly indexing much less of your site, and you didn’t just remove a bunch of content from your site purposefully, that could narrow down your problem.
Asking “what pages used to be indexed that aren’t anymore” can lead you to your problem and hopefully the solution.
3. Blocked Resources (Old GSC)
On this chart, if you see an increase in blocked resources at the same time your traffic started dropping, that could be a red flag.
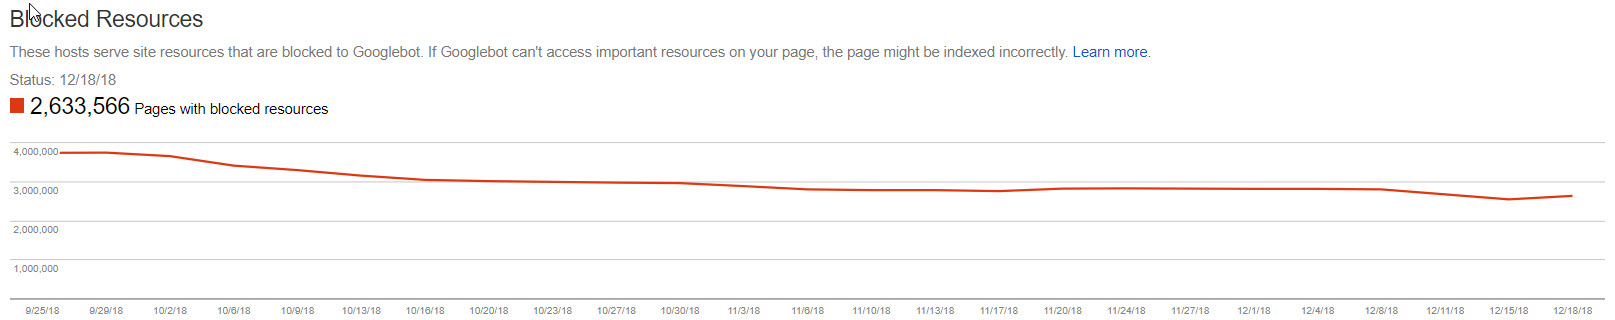
First, make sure you click-in to resources that are on your own domain; blocked resources on 3rd party domains like ad servers or analytics tools don’t really matter and aren’t in your control. You’re looking specifically for pages being blocked on your site by your own robots.txt file or other bot-centric rules.
If you see your domain in the list below this chart, and click into, check to see if any pages are being blocked that shouldn’t be. If you see a page in here that shouldn’t be blocked, you can use the GSC robots.txt testing tool to double-check the page, and if it is indeed being blocked, you can go look at your robots.txt file, page-level meta robots tags, or X-Robots header tags to see where this page is being blocked and unblock it.
This is actually a pretty common cause of organic traffic drops, especially on sites that recently did a redesign or made other major site changes. Sometimes devs will block bots on the dev site, and forget to change that when they roll the site from staging to live. Whoops 🙂
4. Crawl Stats (Old GSC)
The crawl stats graph will show you some data related to Googlebot’s crawl behavior on your site over the last 90 days.
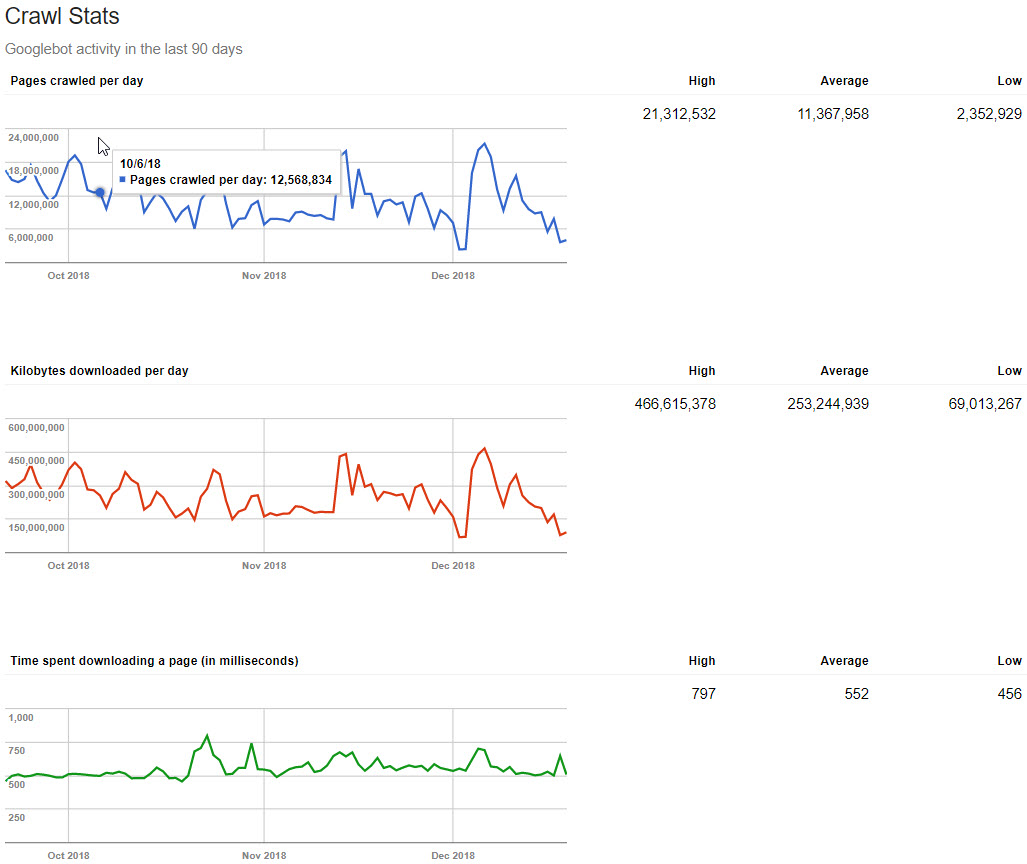
What you’re looking for here is either a decrease in the number of pages crawled per day that is out of character (a sharp drop off; some ups and downs are normal), and/or an increase in time spent downloading each page.
If Google is suddenly crawling a lot fewer pages, and/or your average page speed has dramatically increased (these two usually go hand in hand), then that could help you narrow down your problem.
If page speed is slower, Google will generally crawl fewer pages, and then there area whole ton of trickle down problems that come from slow page speed. If this seems to be a problem on your site, you need to work on fixing your page load speed ASAP.
If page load speed is about the same, but Google is crawling a lot fewer pages, that could indicate other problems (things blocked to bots, server level rules that are blocking bots or IPs or other things, DNS problems, a crawl delay of some sort, etc.)
Again, if you didn’t just purposefully remove or block a bunch of pages, and Google is crawling far fewer pages per day, your problem is most likely tied to blocking Google in some fashion.
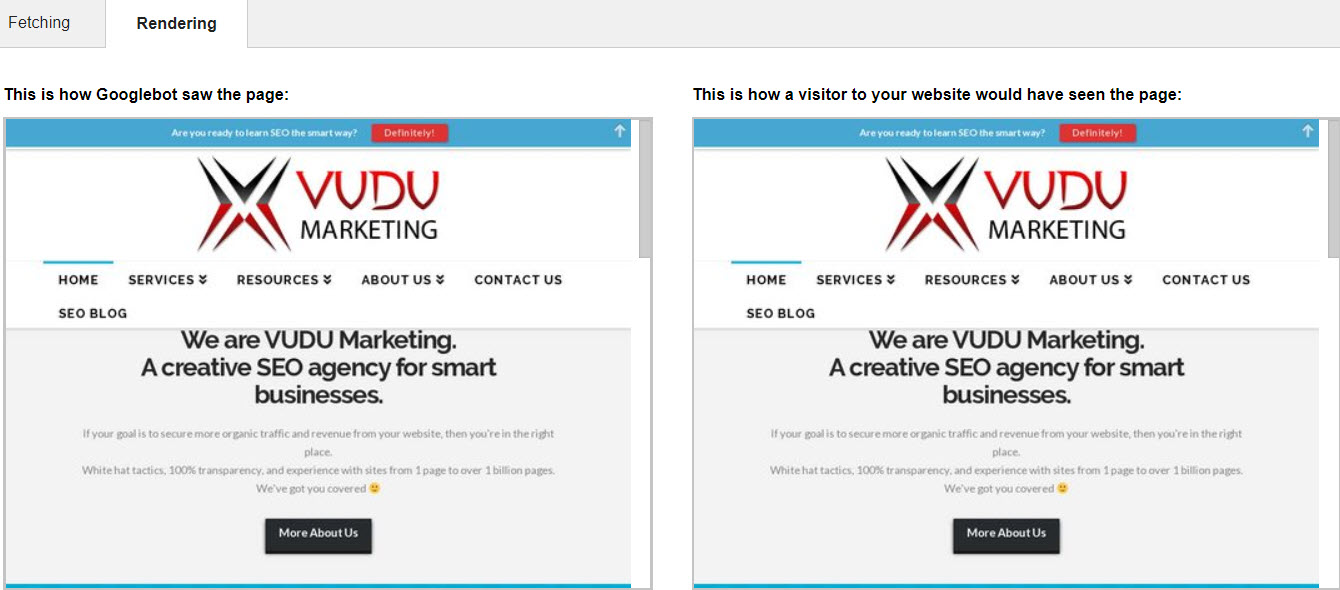
5. Fetch as Google (Old GSC)
Last but not least, especially if your issue is tied to a few specific pages, I recommend using this tool to Fetch and Render, for both desktop and mobile, the pages being affected. This can help you see what Google is seeing vs. what a site visitor would see, and if Google is seeing a blank page, then your problem could be due to how your site is coded and most likely the JavaScript being used.
While Google is supposedly capable of handling all major JavaScript frameworks at this point, in theory, it doesn’t always work that way in practice. Read this and this for reference.
Googlebot doesn’t include anything in their cache or ranking analysis of your page that is pulled in after DOM Complete, so if you are using JS to post-load anything on the page that matters for SEO (text content, images, video), Google likely isn’t seeing it, and thus isn’t factoring it in regard to rankings. And if you changed your code base recently, that could easily cause a huge traffic drop. This guide can help you diagnose if this is a problem.
If you absolutely must post-load content via JS for whatever reason, you should be serving Googlebot a server-side rendered, static version of that page instead of the dynamic version you show to humans. Just make sure the content you show to both is the same, so you don’t get penalized for cloaking! This guide is super helpful.
If, when you run this tool, everything looks fine in both the browser and Google view of Fetch and Render, then your problem is probably not due to code Google isn’t properly handling.
This is pretty simplified, and it could still be something on this front, but probably not.
We already covered checking GSC for Manual Penalties in the first section, so I won’t rehash that here.
And while there’s a ton more you can do in Google Search Console, this should be sufficient to help you narrow down any potential problems.
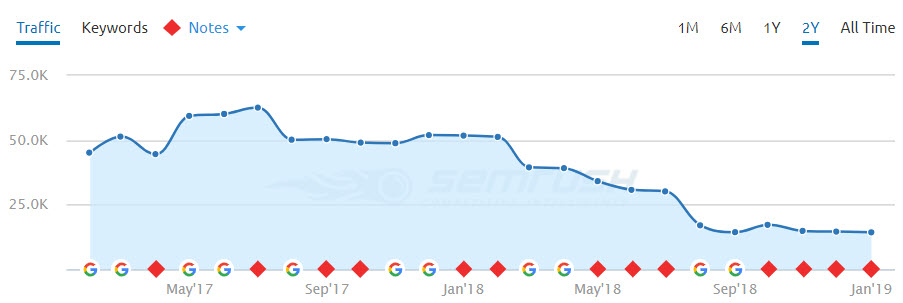
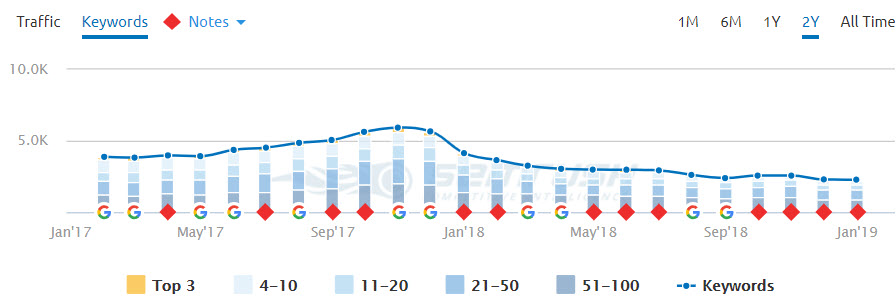
Step 4 – Check SEMrush
While there are a TON of tools out there you could use for this (Majestic, Ahrefs, Moz, SEMrush, etc.), my personal favorite is SEMrush, so that’s what I’m going to cover here.
Why do I like their tool so much? Because they have a MASSIVE ranking keyword data set that spans a ton of countries and goes back for years, and both their UX and UI is fantastic. Easy to use, and easy on the eyes, my favorite combo.
There’s one specific view in here that I look at when diagnosing traffic drops:
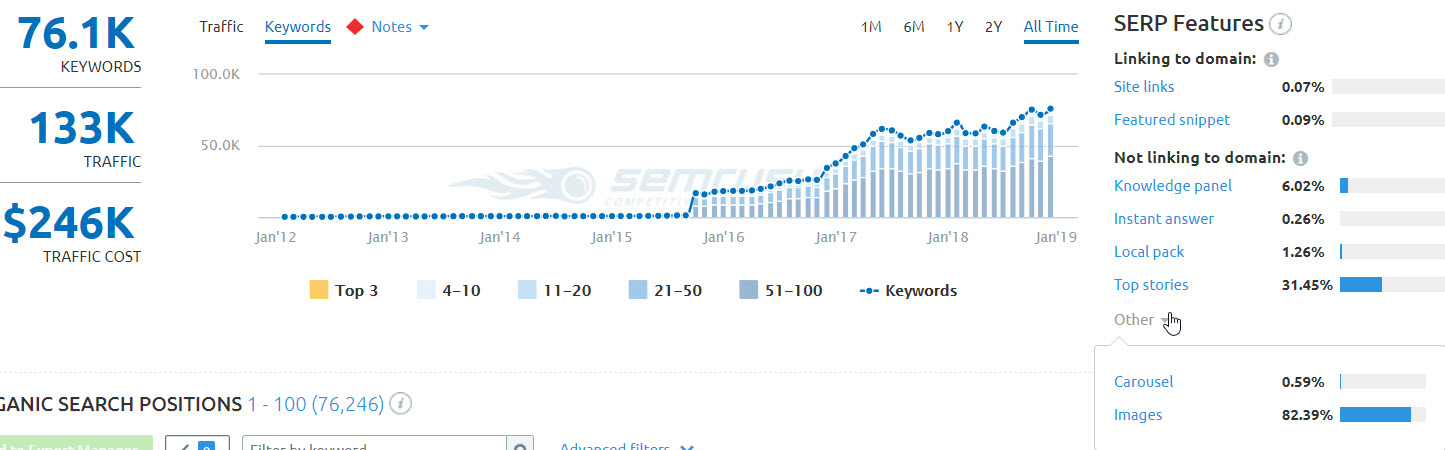
I like to look at things All Time, but if your drop was recent, the 1M or 6M view will probably be more helpful. I like All Time though because I can see what magnitude of up and down is “normal” for this site, and I can then go check if that sort of shift is normal for their competitors. Some spaces just have a lot of shifting in rankings, so a normal size dip or peak may not mean much.
One key thing to take note of in the image above is the list of SERP features on the right. If Google makes a change to the structure of a SERP (adding additional ad units, knowledge panels, images, video, etc.)…really the addition of any additional SERP features, those can cut into the organic CTRs across the board, sometimes massively.
If you’ve been owning a comfy spot in a SERP that had few if any features, and Google added some in, that alone could explain a massive drop in traffic, so bear that in mind. For many SERPs now, the first organic position isn’t even above the fold, which sucks.
Back to the graph, you can also click in on the ranking positions below the graph so you can see trends only for keywords in the Top 3, and/or 4-10 positions (the positions where you’re likely getting traffic from the keywords). You can also hover over the graph, and get specific numbers as opposed to just bars.
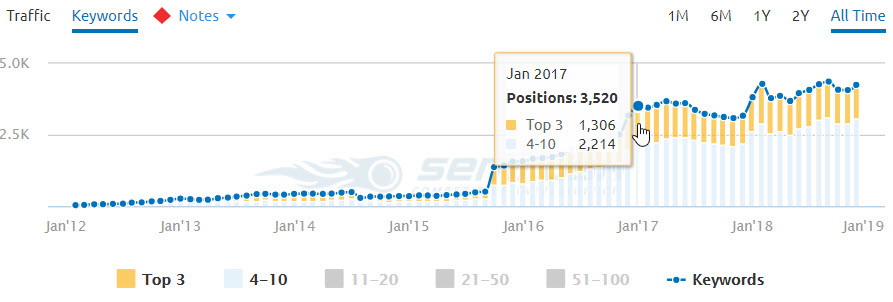
This makes is very, very easy to spot declines in rankings (one of the most common causes of a traffic drop). But, since SEMrush also tracks Google updates and notates the chart, it can also help to easily spot a drop that’s due to an algorithm update.
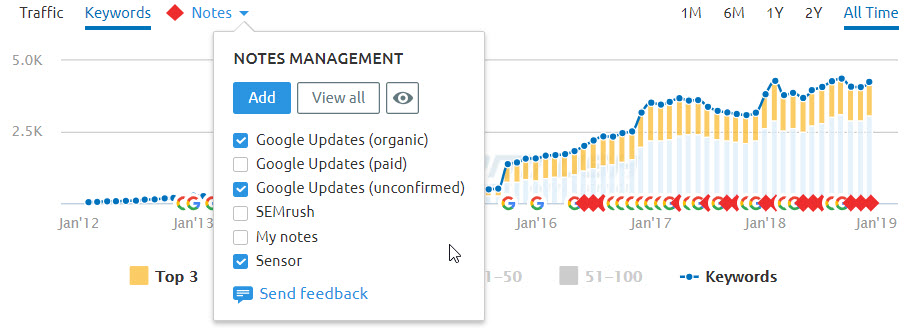
You just click on Notes above the graph, then select the Google Updates (organic and unconfirmed) and Sensor (SEMrush’s monitoring data). Now you’ll see annotations below the graph that you can click on for details.
If you see a clear drop in total ranking keywords, or more specifically a drop in keywords ranking in the top 3 or positions 4-10, and it coincides with your traffic drop, then you can dig further into what keywords declined using another SEMrush tool, Position Changes.
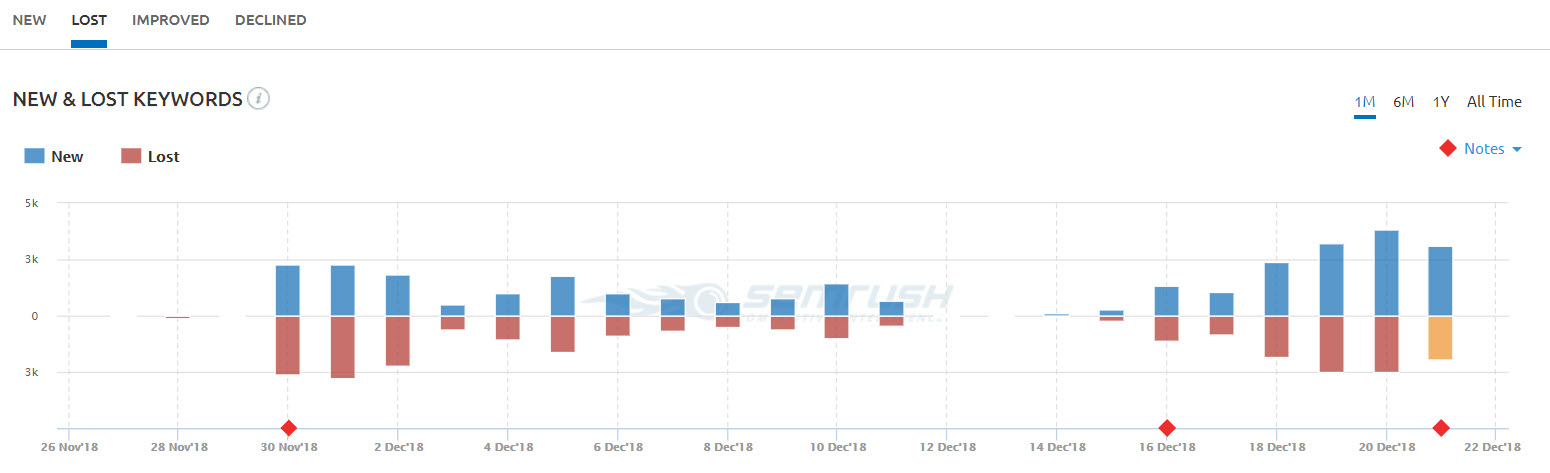
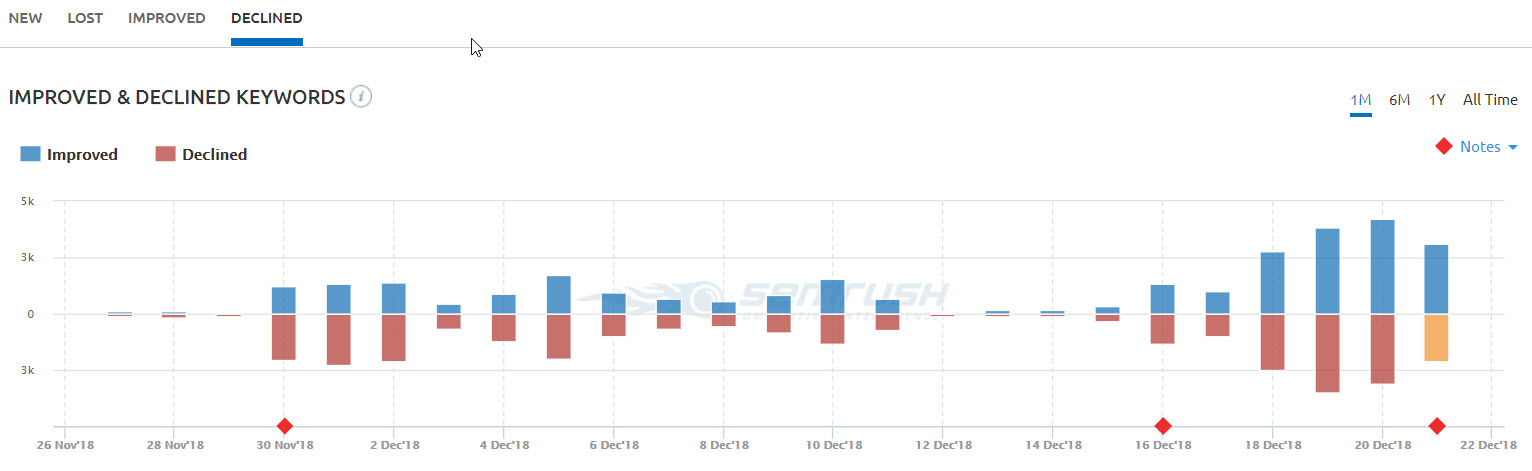 Lost means dropped out of the Top 100 ranking positions, Declined means still in the Top 100 but not ranking as well as it was.
These charts may or may not be very helpful, because keywords ranking in positions 20-100 bounce in and out of the top 100 all the time.
That said, if the keywords that declined or were lost all fall within a certain topic bucket, or are attached to a specific set of ranking pages, that’s a potential pattern, and worth digging into more.
Part of the reason I check so many different tools and data sources is so that I can be certain about a hypothesis.
For example:
Let’s say a site lost some traffic, call it 20%. I heard about a Google update around this time, so that’s a possibility, but I want to double-check.
I see the drop in traffic reflected in both GA and GSC, so it’s a real drop, not an analytics problem. Average CTR and ranking positions are down, and clicks are down, but impressions remain about the same. It appears that it hit the whole site, not just a specific set of pages, and the drop is about the same across all device types and countries.
I don’t see anything being blocked to bots, and the pages look fine with Fetch and Render. I don’t see an increase in crawl errors. Google is crawling fewer pages each day, but my indexation numbers are about the same, and I don’t see a manual penalty in GSC.
So I check SEMrush, and I see a decline in rankings. The ranking decline matches up with the organic traffic decline seen in GA and GSC. I check the annotations, and see that all of this occurred at the same time as the Google Medic update, which says it hit sites in the health and wellness space.
I compare the link profile of my site with the other sites now outranking me, and I see that I have far less Domain Authority and Total Linking Root Domains than the sites ranking above me. My site is a newer site in the health and wellness space, and clearly hasn’t built up enough authority in the space to rank well post-update.
Problem solved. There’s a 99% chance my site was hit by this update, and the only way to fix it will be with time and effort to make myself more of an authority in the space. More and better links, longer and richer content. Not an easy fix.
No single tool could have told me this story clearly. But each subsequent tool and piece of data helped to solidify the cause. Now I have enough data to go to my boss or team and make my case for what needs to be done.
So now you can see the importance of A. having a process to go through to get to different data points, and B. the most common causes of a traffic drop.
The odds are REALLY good that you’ve solved your problem by now, and if so, congrats!
But, in a small number of cases, you’ll have gone through all of these steps, and still won’t have a concrete answer for what’s going on.
And so, on to Step 5.
Step 5 – Check Google Trends
Now to be fair, this is a fairly easy thing to check, and if you want to do this earlier in the list of steps, all power to you.
But I’ve found that a sudden traffic drop rarely has anything to do with search behavior changes. Sudden traffic drops should be explained by the steps above, in almost every case.
Long slow drop offs are another story though.
If your traffic decline has been a slow death over an extended period of time, then this could very easily be the culprit.
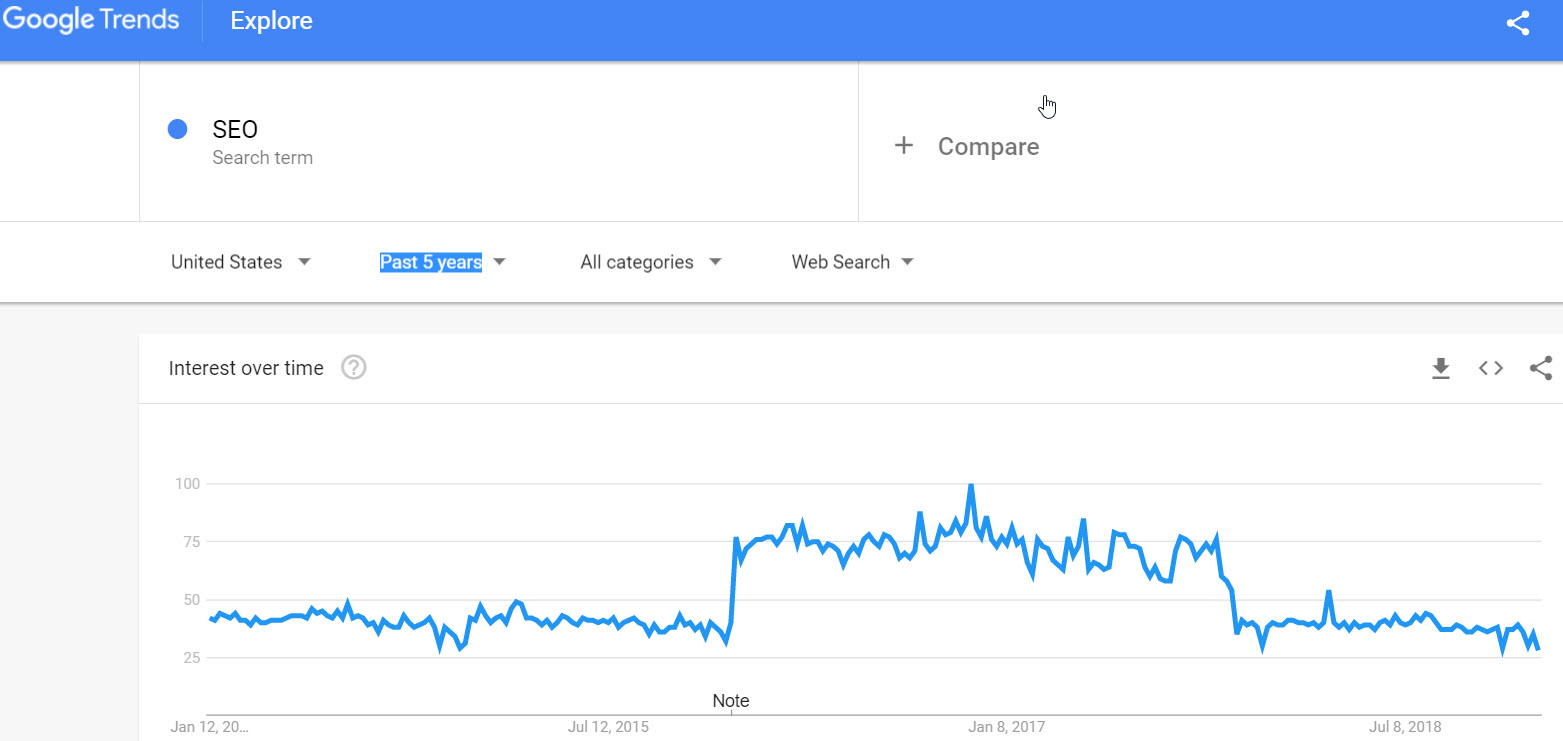
Google Trends is a handy tool that will show you the relative search popularity of a term or topic over time, by location. You can compare up to 5 terms at a time, which is very useful. You can also look at data going back to 2004, which is amazing.
I’d recommend setting the range to at least the last 5 years, though you can shorten it if you want (you should look at a minimum of 2 trailing years, so you see seasonality year over year). Set the country to the country you get the most traffic from (or, if you noticed a drop from a specific country in Google Search Console, use that country). Now drop in your 5 most popular search terms if your loss has been site-wide (you can pull this from GSC), or the terms you’ve lost traffic from if you’ve been able to narrow it down.
How does the search trend look over time? Have things have declined recently, either sharply or a slow decline over time?
If you look at the last 16 months of performance data in GSC, and a similar time-frame in Google Trends narrowed to your top KWs, does the decline on both graphs look similar?
If you haven’t found a specific issue after going through the other steps, and your decline as shown in GSC/GA matches up with a decline in Google Trends, then you’re probably just facing an industry decline.
When I used to work in the stock photo space, I saw something like this. Stock photo terms were declining year over year, even as more competitors were coming online. We were fighting with a growing pool of competitors for a shrinking pie…not a good position to be in.
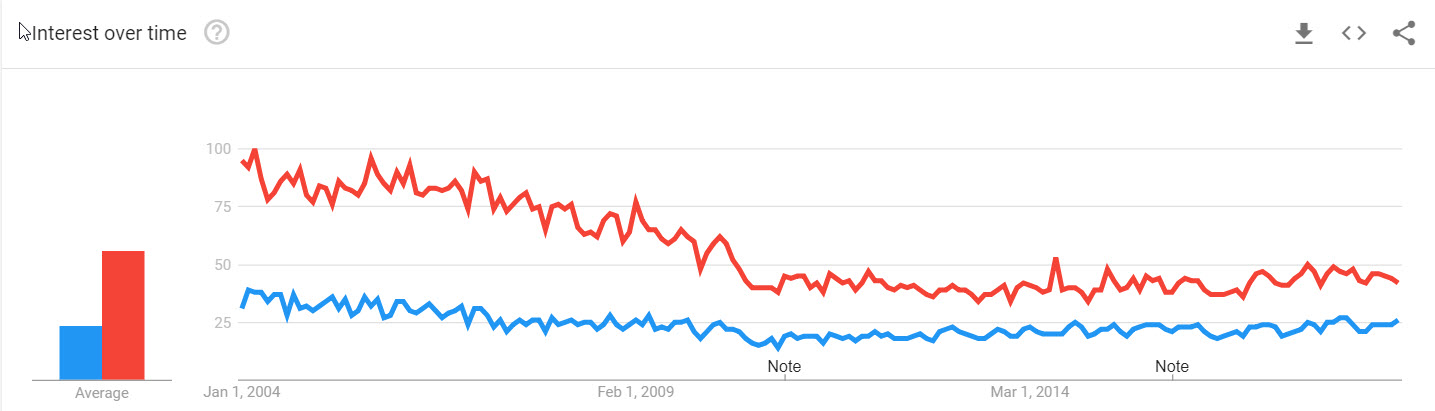
If this is your problem, I recommend digging into various keyword tools to find other keyword phrases and topic buckets you can go after, maybe that are closely adjacent to your industry, or that are of interest to your target market even if they aren’t directly in your wheelhouse. In this way, even if interest in your industry is shrinking, you can still find ways to expand the pie.
Step 6 – Crawl the Site
Now some folks might argue that running a crawl on a site should be an earlier step in the process. And to be fair, you can absolutely do that…but crawling a site isn’t very straightforward to a non-SEO, which is why I’m covering it later in this list.
Of course, if you’re a decent enough SEO to be familiar with crawling tools, then you probably don’t need this post, so there’s that 😉
There are a variety of great crawling tools out there: Screaming Frog (my personal favorite), Sitebulb, Deep Crawl, ContentKing, and Botify are the best of the bunch.
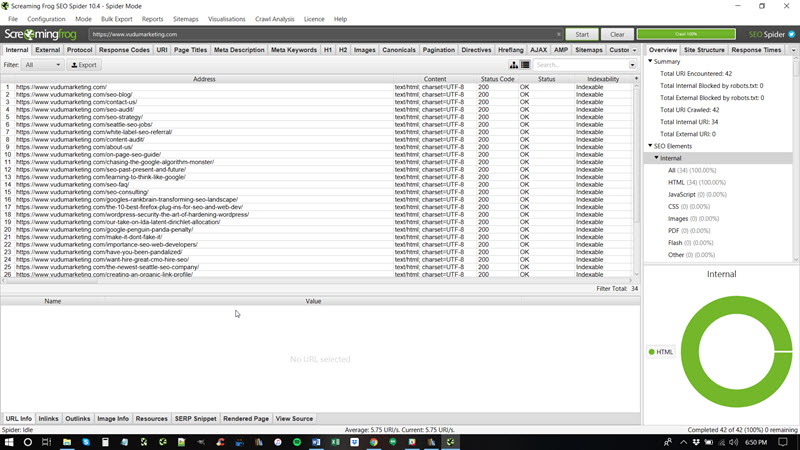
I’m not going to walk you through how to run a crawl here…this post is long enough, and other folks have written excellent guides on that already. This guide to Screaming Frog crawls is one of my go-to resources, courtesy of the amazing Seer Interactive.
Here’s a great overview video as well:
In a nutshell, these crawler programs go through your site and extract SEO-centric data, much like a search engine, and then report the data to you for analysis. Crawls can help spot many, many potential problems.
If you have someone SEO savvy or at least technically savvy on your team, I’d recommend running a crawl of your site at least monthly to help spot any issues.
You can also connect these tools to 3rd party data, like Google Analytics, Google Search Console, and various link and keyword data providers. This will greatly augment the value of the crawl data, and in some cases will help you spot things you couldn’t otherwise (like orphaned pages).
Some of the common problems crawlers are great at identifying that aren’t easily found in other ways (especially at scale across large sites):
- Redirect Chains (many redirects strung together)
- Redirect Loops (when page A redirects to page B and page B redirects back to page A…you can create something like this either with redirects, or even with rel=”canonical” tags, and this is pretty bad)
- Orphaned Pages (when a page isn’t linked to internally…you can only find this if you augment your crawl data with GA/GSC data)
- Pagination Problems (pages in a series, using rel next and rel prev)
- Hreflang Problems (markup designed to help sites with multiple country/language versions of the site or specific pages)
If that all sounds like gibberish, read that guide on Screaming Frog I linked to above, it’ll make more sense!
Crawls of course also extract all the key on-page SEO elements for each page on the site, so it can help you spot issues on that front as well. In fact, a crawl is the backbone of the SEO audits I do, and helps me quickly and cleanly identify many critical issues.
Some traffic drops are due to small problems compounded at scale…say, the removal of Meta Descriptions across a large site during a redesign, resulting in Google showing a Meta Description of their own choosing, often resulting in lowered SERP CTRs for all pages, resulting in lower traffic site-wide.
I’ve seen this happen, more than once, and it’s a pattern that isn’t easy to spot without a crawl.
As you can see, running a crawl can find a lot of issues, but it’s also not a task for someone unfamiliar with SEO and web development, so it might be easiest to hire an SEO consultant for this particular piece of the puzzle.
Step 7 – Check Your Server Logs
*Super Technical Eyes Glazing Over Alert*
Every website is hosted on a server, and every server keeps a log file (a file containing data about every IP and user-agent that visits the site).
This file can help you find pages getting visitors that aren’t being linked to internally, or pages that are getting a ton of visits from a certain IP or IP range.
They can show you which search engine crawlers are hitting which pages, with which frequency. It can also show if crawlers aren’t reaching certain pages, or the whole site.
Note – If you aren’t super tech-savvy, just skip this section and have your web developer read it. Server logs are not for the faint of heart.
If you haven’t found any problems with your robots.txt file, or your meta robots tags/headers, or your htaccess file, but you still suspect that you’re blocking bots in some fashion, then this is the place to check.
The same folks who make the Screaming Frog crawler also make a log file analyzer, which is great at helping to organize and visualize log file data (which in its native format looks a lot like gibberish). This video gives a great overview:
Keep in mind that log files can be HUGE (many gigabytes, sometimes much larger), so transferring and loading up those files can be a pain.
If you find yourself needing to poke through log file data frequently, it might be more efficient to get a Splunk license and use that instead, though you’ll need to go through some training to get the most out of it (it can be very complicated).
While you can get a lot from log files, the things I most look for are what content Googlebot is and isn’t crawling, the frequency (how often they hit certain pages), and if there are pages being visited or crawled that aren’t linked to from anywhere.
I use log files largely as a sanity check if I think I’ve identified a problem related to bot access or blocking, but haven’t been able to spot the directive or code doing the blocking through other tools, and also to see how long it takes for Googlebot to crawl new content that goes up on a site (helpful to know, especially for sites that deal with news).
Step 8 – Check Your Links (Ahrefs, Moz, Majestic)
I’d give it a 99% chance that you’ve found the problem by now, and if you haven’t, there’s really only one place left to look: your link profile.
Neil Patel wrote a great guide on various link index tools over here, which is a helpful overview. Check that out.
Usually, Google is pretty good about throwing a warning in Google Search Console if you’re in trouble for something link related…but not always.
Here are 2 key things you should watch for when examining your link profile:
- An unexpected increase in new links, particularly to the homepage or a specific internal page, especially if they use keyword rich anchor text
- An unexpected decrease in links, especially if it’s a large drop
For the first, an unexpected increase in new links, especially if the source of those links and/or the content on the pages the links are coming from looks shady or low quality, could represent a negative SEO attack from a competitor.
While Google largely neutered the simplest forms of negative SEO with the Penguin 4.0 update in 2016, there are still some more sophisticated ways of doing negative SEO that still work.
Of course, it could also be a bunch of shitty links being built by your SEO company, if you have one retained, as not all SEO companies offer equal quality. Make sure you only work with reputable SEO companies!
If you see an unexpected increase in shady links, you can usually just ignore them…Google is really good at spotting and neutralizing links like that. But if you suspect you’re being penalized for it, submit a disavow file in Search Console containing the questionable links, and say you think you’re being hit by a negative SEO attack in the notes when you submit the file.
This should be more than sufficient.
For the second, a decrease in links…this one is a bit harder, because off the link indices out there (Moz, Majestic, Ahrefs, etc.) vary the size of their index month-to-month as they find new links and prune old dead links, so a drop, especially if it’s a small drop, might mean nothing.
Because of this variance month-over-month, these tools are better for comparing your site to your competitors on a regular basis, and less helpful for just counting your own links.
What I recommend, in addition to monitoring your link profile and those of your competitors, is to keep a note of the index size of the tool you’re using each month, and calculating the % change in index size month-over-month. If the index decreased by 5%, but your links dropped by 20%, that’s probably something to worry about.
Each link index tool is very transparent with their index size data, and they update it often, so tracking the absolute numbers is easy.
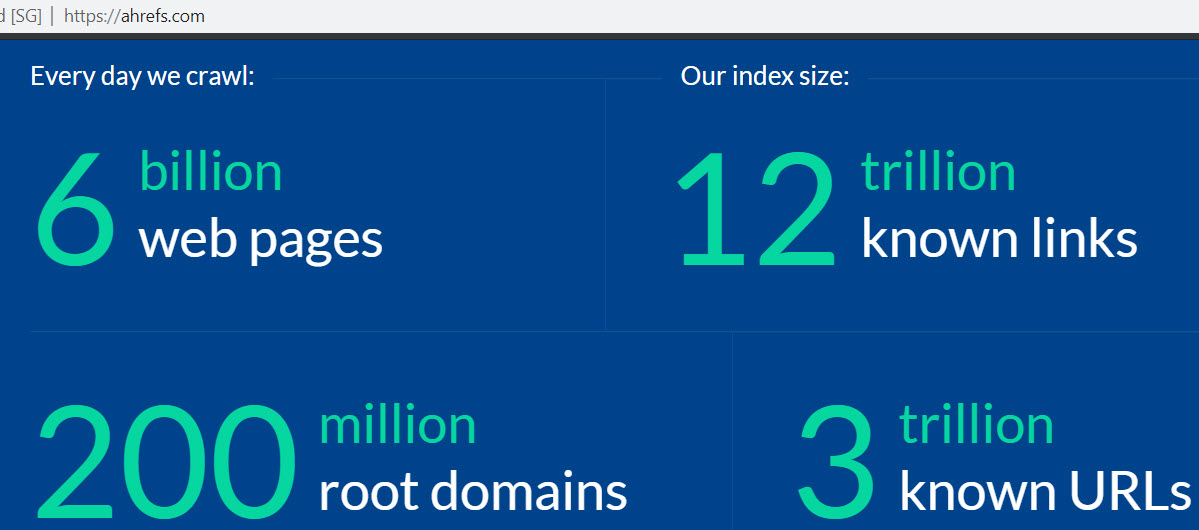
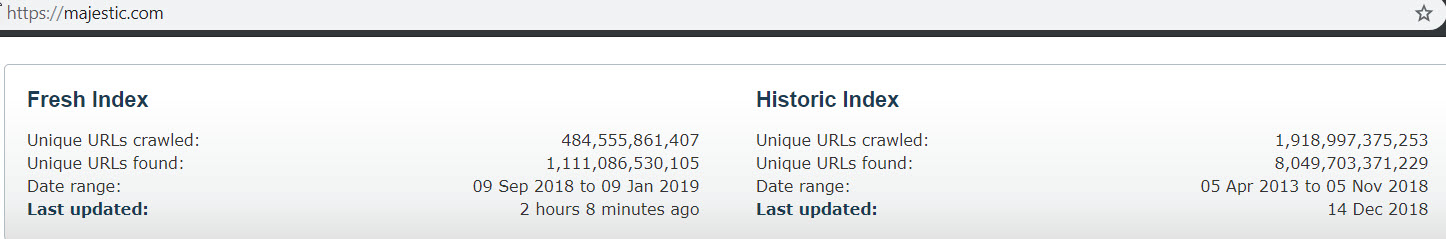
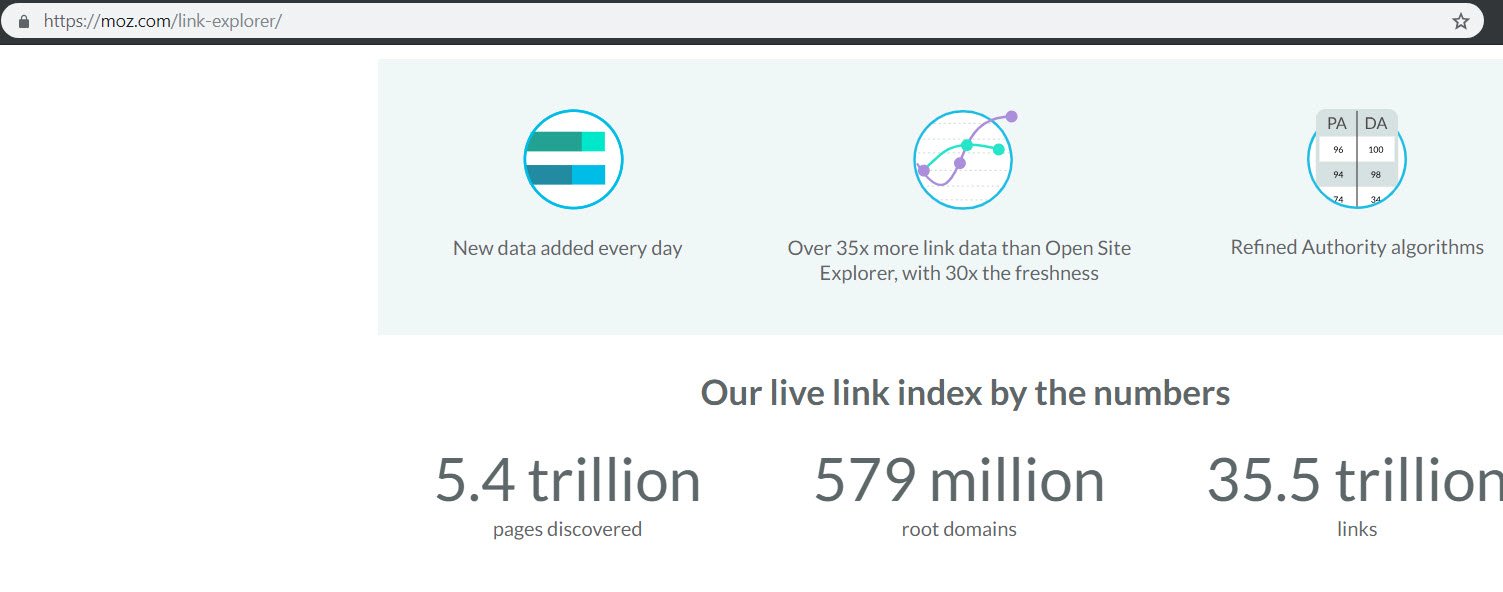
Ahrefs has the smallest index size at present, but their UX and UI is great. Majestic has by far the largest index, but their UX and UI is crap. Moz is comfortably in the middle.
As you look at this data, be aware that some link attrition is normal. Websites and pages are taken down, links break, sites and pages are sold and changed, etc. The web is in flux, and so too is your link profile, like it or not.
But if you’re losing an unusually large number of links, a few things are possible: you might have had links coming from a link network or PBN that was taken down (don’t use crap like that), or perhaps a partner site that linked to you many properties went down or took the links down.
There are lots of possibilities, but just be aware that a loss of lots of links will almost certainly hurt your rankings, and thus your organic traffic.
If you haven’t found the problem anywhere else, and you’ve seen a steady or large sharp decline in links over the last few months, that could very well be your problem.
At the end of the day, pick a tool (Moz is my favorite), and monitor your link profile and that of your top 3-5 competitors each month, and pay attention to the trends.
If you want to stay competitive in your space, you need to make sure you’re A. getting more/higher quality links than your competitors, and B. building links fast enough to keep ahead of the competition.
If your competitors have a huge head start, this is easier said than done, but in general, all else being equal, the site with the highest number of linking root domains usually ranks the best.
This is an oversimplification, but directionally accurate, so take it with a grain of salt.
Conclusion
As you can see, there are many times many things that can cause a loss in organic traffic, and finding the culprit can range from super simple to insanely complex.
This guide represents my personal process, and covers everything I’d look for if I were hunting down the source of a traffic drop.
If your site has suffered a traffic loss, and you don’t want to wade through everything covered here, I’d be more than happy to do an SEO audit for you and find the problem!
Also, I’d strongly recommend putting something like ContentKing or Little Warden in place to help monitor for potential problems going forward. These tools can monitor your site regularly and alert you to changes or problems with key SEO elements.
If you have questions, or if there’s something you think I should mention in here that was left out (I’m sure I spaced it on something!), just let me know in the comments.
Comments 8
Great stuff Sam. While I see a lot these traffic drops originate from website changes, we have seen our fair share of Google updates over the last 6 months. It’s been completely mental, so prioritizing that makes a lot of sense.
Author
Thanks Steven!
Very well explained. I still find that people are comparing previous week without taking into consideration differences in patterns throughout the month, behaviour, special events etc.. You hit the right spot with comparing data with same period last year.
Author
Thanks Ilias!
This was a long, but insightful read. I loved how you took a step-by-step approach in explaining this concept. It can be a daunting process when it comes to looking for a cause of the drop, but once you get to the bottom of it, it feels great to be able to “fix it”! 🙂 You mentioned many tools you use, and I also tested some of them, but seems like Nightwatch.io could be added to your toolkit in 2019! 🙂 Have you tried it?
Author
Thanks! I haven’t heard of Nightwatch, but I’ll check it out.
Well, this made me check Google Trends because it was the only article that made a compelling argument for that – the “slow death” part is just what’s happening to us. We’ve been seeing a 20-30% dip in traffic overall on our website and it was confusing because nothing else had changed. So I went over to Google Trends and realized that my whole niche had a 20-30% dip and then I checked my competitors and realized they also lost keywords and traffic.
This still seems a bit odd. Why are we losing keywords too if it’s just a trend drop? Shouldn’t it be just traffic? And why does our traffic dip have a delay of about a month? Something still doesn’t add up.
Anyway – thanks for the article, we actually have a better idea now of what could be wrong.
Author
You’ve probably lost some keywords due to Google’s core algo updates this year, which has gotten better at matching query intent. Doesn’t mean those keywords drove traffic though. Could be entirely separate from the traffic loss.
If your niche is down though, that’s a very good explanation for the traffic loss piece.